By selecting a minimal set of Plot Controls it is possible to maximise the graph acreage within a plot window. Since the Plot Controls are applied to the active plot a user can have different 'views' for the each plot.
Tip: When using a very small plot window it is often sensible to disable the Plot Cursor to prevent accidental interaction with the plot
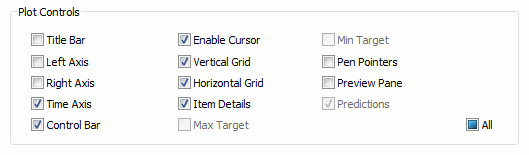
To select a specific Control check the appropriate tick box.
Note: The Plot Controls can also be toggled by Right-clicking over the chosen plot window and selecting the View sub-menu.
|
Control: |
Description: |
Applicability: |
|
Controls whether the Plot Title Bar is displayed for the current plot.
Note: A number of the plot operations require the Plot Title Bar in order to operate such as the Arrange functions, Selected plots etc. The Plot Title bar can be turned on temporarily via the right-click->View->Plot Title option to access these operations. |
All. |
|
|
Left Axis |
The Left-hand Y-axis. |
Strip-charts & X-Y plots only. |
|
Right Axis |
The Right-hand Y-axis. |
Strip charts only. |
|
Time Axis |
The Time Axis. |
Strip charts only. |
|
Control Bar |
The Plot Time Scroll bar and the Plot Activity Button. |
All. |
|
Enable Cursor |
Enable or Disable the Plot Cursor functionality. |
All. |
|
Vertical Grid |
The vertical grid lines on the plot for Strip Charts and X-Y Plots or the radials for a Radar Plots. |
All. |
|
Horizontal Grid |
The horizontal grid lines on the plot for Strip Charts and X-Y Plots or the circular percentage lines for Radar Plots. |
All. |
|
Item Details |
The Item Details Area. |
All. |
|
Max Target |
Display the Maximum target outline on the Plot. |
Radar plots only.
|
|
Min Target |
Display the Minimum Target outline on the Plot. |
Radar plots only. |
|
Pen Pointers |
Controls whether the new data Pen Pointers should be displayed on the right hand edge of the trend.
|
Strip charts only. |
|
Predictions |
Display any Predictions that have been defined for pens within the active Plot. |
Strip charts only. |
|
Preview Pane |
Enable the Preview Pane so that the latest values can still be viewed when zoomed out such that Compression Mode is in effect. |
Strip charts only. |
Note:
Tips: Toggle the 'All' checkbox to quickly enable or disable all of the plot controls.