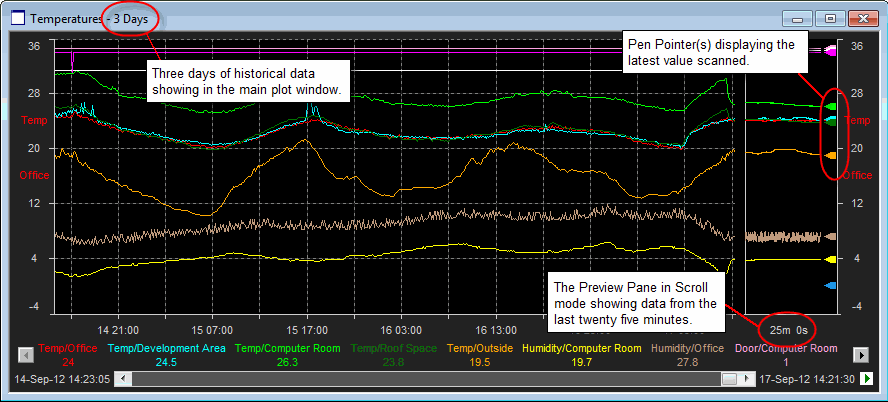
The Preview Pane provides a view of the latest data values for plots which are zoomed out such that Compression is in effect. This allows the user to monitor live data at the same time as viewing longer plot durations.

Note: The settings for the Preview pane can be set on a per plot basis and are stored in the Plot File so they are maintained across plot invocations.
To activate the Preview Pane:
From the Plot menu, View and select Preview.
OR
Right-Click on the desired plot and then click View followed by Preview Pane.
OR
Check the Preview option in the Plot Controls section of the Plot Properties View Tab.
Two modes of operation are available for the Preview Pane. These are Scroll and Incremental Mode. Each will now be discussed in more detail.
When set to Scroll Mode, the Preview pane will display a continuing scrolling window onto the live data that is being scanned. Unlike Incremental Mode, the user can set the duration of the Preview pane to any desired duration up to a defined limit.
Note: As the plot duration is not related to the bucket size used for compressed data, it is possible for a point to appear both in the Preview Pane and also within the main plot. Similarly it is possible to set the Preview Pane duration such that there is missing data. For example, if the bucket size is set to 2 minutes, but the Preview Pane is only showing the last minutes worth of data.
Tip: To ascertain the duration of a bucket, view the Update Strategy Section of the Plot Properties Details Tab. The current bucket duration is shown in the Refresh Rate field.
When set to Incremental Mode, the Preview pane duration will reflect the period of time that is represented by a single pixel within the plot display, this is commonly referred to as the 'bucket size'. Individual data values within the current (and potentially incomplete) bucket will be shown in the Preview pane, with the value of every previously completed bucket being represented by a data point in the main plot window.
When all the points within the current bucket have been collected, the preview pane will be cleared and the compressed data value from the bucket added to the main display. Data for the next 'bucket' will then appear from the right hand side of the Preview pane.
Note: Incremental mode ensures that every data point that has been scanned is visible within the plot, either as a compressed value in the main plot or individually within the preview pane. This is maintained when zooming as the duration of the preview pane is adjusted to reflect the new bucket size.
Tip: The Compression Mode used in the main plot can be configured by the user on a per plot basis. See the Plot Properties Details Tab for more information.