stPro scans data from the chosen Data Source at a pre-defined frequency (see the Update Strategy section for more details).
When the plot display is zoomed in to a short duration it is likely that the trend will be able to display data at the requested scan frequency, since there will be less data points than pixels. However, when the plot is zoomed out to display longer durations it is unlikely that the graph will continue to be able to display all the data points. In such situations stPro employs a Compression algorithm to define how to the data should be displayed.
The Compression section of the Plot Properties Details tab details:
The Compression Ratio - how many data items are represented per pixel on the graph.
The Compression Mode - the algorithm to employ when 'compressing' multiple values into a single pixel.
Note: The default Compression Mode is 'Single Point' (see below).
|
Control: |
Purpose: |
|
A ratio showing the relationship between the number of data values and the pixels on the display. The format of the ratio is Values:Pixels.
A ratio of 1:1 indicates there are enough pixels to display that a discrete data value for each comb point at which data was scanned on the X-axis of the graph.
When zooming out, the Values component of the ratio will increase. A ratio of 16:1 indicates that there are sixteen data points to every pixel on the graph. The Compression Mode then defines the algorithm to use when calculating the value to display based on the actual set of sixteen values.
When zooming in, the Pixels component of the ratio will increase. A ratio of 1:16 indicates that there is one data point every sixteen pixels indicating that the data is sparsely displayed on the trend.
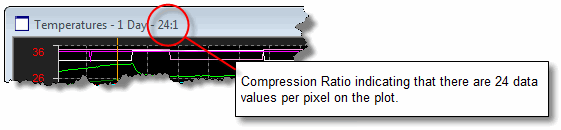
Tip: The Compression Ratio can be displayed on the title bar of each plot via the "Title Shows Compression Ratio" User Preference. See image below:
|
|
|
Mode |
The available Compression Modes are:
If the Single Point stratgey of 'dropping' data points is felt to be inappropriate, the user can choose from one of the following Compression Modes which will then calclate the value to displaye based on the chosen algorithm.
Tip: Users can set their own preferred default Compression Mode via the User Preferences Plot tab. Note: Not all of the Compression Modes are available for all of the Graph Types. |
|
Ignore Missing Samples |
This control only applies to Radar Plots in Average Mode and instructs the averaging logic to ignore any data samples that have returned bad values or for which no data was scanned.
Tip: When this option is used missing data is indicated by appending (M) after the item value in the item details. The item tool-tip also displays the number of good samples (i.e. 375 out of 400). |
Graph Style Variations
Radar plot operate differently from the other graph types, in that the only ever display a single value per pen (as opposed to Strip Charts or X-Y Plots which display a number of values per pen).
In Average mode Radar Plots continue to display only one value, but the value is an average based on the plot duration rather than a 'spot' value from the most recent scan.
Tip: Values from previous scans can be viewed by 'scrolling' the chosen time period for the Radar Plot.