Overview
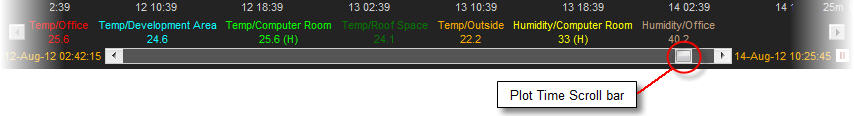
The Plot Time Scroll Bar is located at the bottom of the plot window. It allows the user to scroll the time axis for the plot.
The extreme left and right ends of the scroll bar represent the limits of the data held in the Data Source. The time currently displayed relative to the start and end of the data held is indicated by the position of the slider on the scroll bar.
Tip: The length of the slider in proportion to the length of the scroll bar provides an indication of the length of the time period displayed on the plot.
Using the Plot Time Scroll Bar
There are three ways to scroll using the Plot Time Scroll Bar:
Clicking the left mouse button over the left or right arrows at the end of the scroll bar - this will scroll the plot by one tenth of the screen width.
Clicking the space between the slider and the end of the scroll bar - this will scroll the plot by a screen width.
Dragging the slider along the scroll bar by holding down the left mouse button and moving it to the desired position before releasing it.
Note: Scrolling the Plot Time Scroll Bar will automatically switch the Plot Activity Button so that the plot is not updated when new data is received.