The Y-Axes
The Y axes on either side of the plot are used to display scales for items that are mapped to pens within the active plot.
Note: Both the left and the right operate in the same manner.
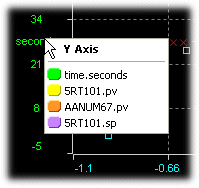
Changing the Item displayed on a Y-Axis
To change the item that is displayed on one of the Y-axis, do one of the following.
|
Either:
Tip: This method is useful when the user can readily differentiate between the items assigned to pens without the need for additional details to be displayed.
OR:
OR:
|

|
|
|

Tip: This method is useful when the user needs additional information such as the Data Location, pen number or pen color in order to differentiate between the items assigned to pens.
Changing the presentation of the Y-Axis Labels
Various options exist for how the Y-axis labels should be displayed in stPro, such as "Pen Color", "Foreground" and "Current Value".
Tip: See the Y-Axis Labels Mode section of the User Preference dialog for more information about the various options.
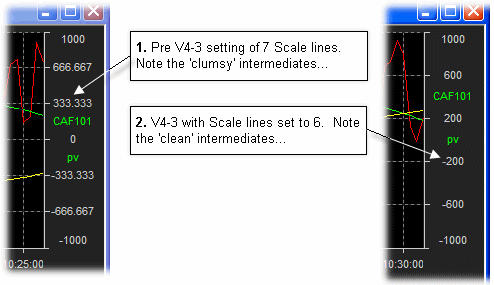
For release V4-3, a new feature was added allowing the user to define the number of Y-axis scale lines within a plot. In previous releases, the number of lines was automatically calculated, which meant that on occasion the intermediate values were not whole numbers.
The user can now specify the required number of scale lines as a User Preference (which applies to all new plots) or on a per plot basis via the Plot Properties Details tab.

Note: It should be noted that the setting is a maximum. Should the plot size reduce to the point that the chosen setting no longer fits, the number of Scale lines will be automatically reduced (hence the fact it's a maximum).


