Release V5-4 is the latest version of SapphireTrend, Jemmac Software’s world leading real-time process visualization package. Headline features in V5-4 include the introduction of the Data Viewer, Item renaming from one DL to another, X-Y Boundary enhancements and the highlighting of multiple new data pairs for X-Y’s and more…
Data Viewer
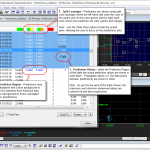
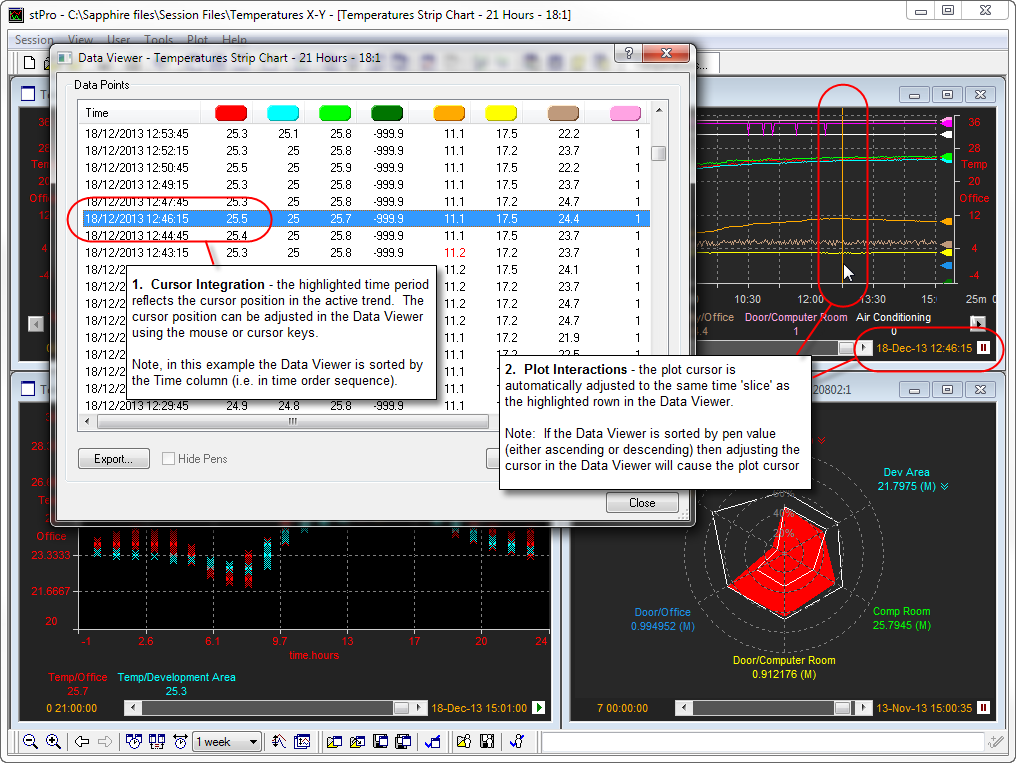
The Data Viewer provides a tabular view of the data displayed within the active plot. It allows the data to be analysed, sorted, reviewed and exported in a convenient dialog whilst maintaining the graphical view of the data within the plot window.
- The Data Viewer operates in a non modal dialog displaying values from the active plot that can be placed anywhere on your desktop (so outside of the stPro application window).
- The data can be sorted by time sequence, or is ascending or descending value order for each pen.
- If the plot cursor is on within the active plot then the corresponding time row will be highlighted in the Data Viewer. Conversely, changing the highlighted row in the Data Viewer will cause the cursor within the plot to be adjusted accordingly.
- The Data Viewer displays both live data and also predictions – allowing a full view of all the values for all predictions sets within the current plot.
- Changing the active plot automatically switches the focus of the Data Viewer to the new plot.
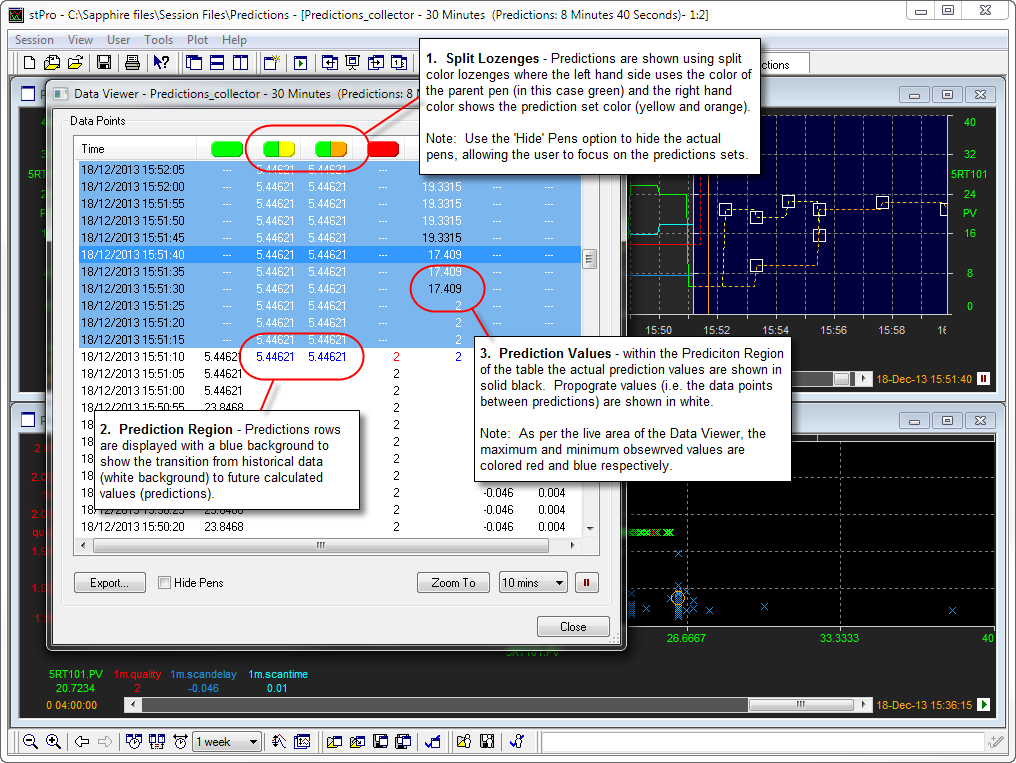
- The maximum and minimum values for each pen are displayed in red and blue respectively.
- When the plot cursor is active the corresponding time row is highlighted in the Data Viewer. The cursor position can then be driven from either the Data Viewer, or the plot window.
- Plots can be turned On or Off-Scan from the Data Viewer allowing in-depth analysis of the data to be performed without updates occurring.
- The Data Viewer integrates with the Quick Export function allowing the data within the viewer to be exported to a CSV file for further analysis.
Highlighting New X-Y Data
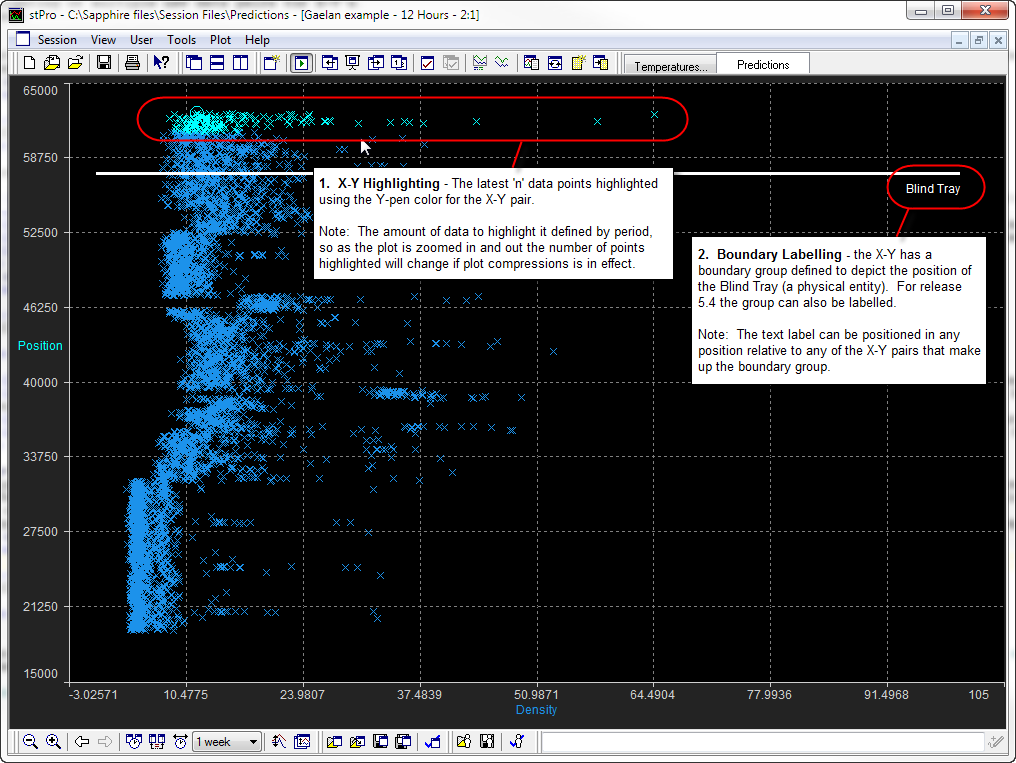
With X-Y Graphs (either Scatter or Line style) it can be tricky to work out which data points are newest on a plot. So for release 5.4 we have added a new User Preference called “Highlight new X-Y data”. This colors the ‘n’ most recent data points in an X-Y graph using the pen colour from the Y-pen. This new data is therefore easily differentiated from older ‘stale’ data which uses the pen colour of the X-pen.
The option can be overridden on a per plot basis (via the Plot Preferences) allowing different amounts of data to be highlighted depending on the specific data set being used.
New Automation API
A new method called LoadTabSet has been added to the already extensive stPro Automation Interface API set allowing the user to load a Tab file when scripting the execution of stPro from VBScript, or other external applications.
For more details about SapphireTrend, see the Product page for it.