
In January 2021 Jemmac released version 6.4 of SapphireTrend, our world leading real-time process visualization package (see here).
Since then, we have been hard at work adding a range of features and enhancements to stPro – our advanced desktop multi-trend application. The aim being to simplify and streamline common operations such as building new trend plots and sessions.
Each new feature results from close co-operation with our power users located across the globe. People already familiar with the class leading performance and capabilities of stPro and with enthusiasm for contributing ideas and suggestions to help streamline an already slick product, making it that little bit more powerful and intuitive.
We hope you are as excited by the enhancements as we are!
- Note: The features described require SapphireTrend release 6.4.0.82 or higher.
Add Auxiliary Pens
Best Practices
When building trends it is typical to start by mapping a Process Variable (PV) as the first pen, and then add associated parameters such as the Setpoint (SP), Output (OP) and limits as additional pens.
Sites often define best practices on how these pens should be set up – such as the colors, line styles and scaling to use. For example, the SP might use the same pen color as the PV, but have a different line style and have its scale linked back to the PV.
Similar rules would be followed for the OP, limits and other associated parameters helping plots to look consistent and therefore become easier to analyze.
Whilst Sapphire allows plots, sessions and tabs to be saved, the initial effort required to build them can can be both time consuming and repetitive. Especially when following best practices/site preferences similar to those described above.
When a large number of pens as required this can become an onerous task, with similar configurations required across multiple plots, sessions and tabs.
Solution
The Add Auxiliary Pens feature addresses this by performing the common steps needed to setup and scale pens with just a few mouse-clicks.
The item name for the new pens is derived from the master pen based on the sub-option chosen. stPro then automatically applies the best practice conventions for pen colors, line styles and most importantly of all – scaling. This allows users to go from a plot with a single pen to a fully formed multi-pen trend within a matter of seconds.
Operation
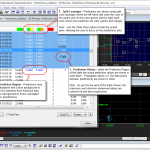
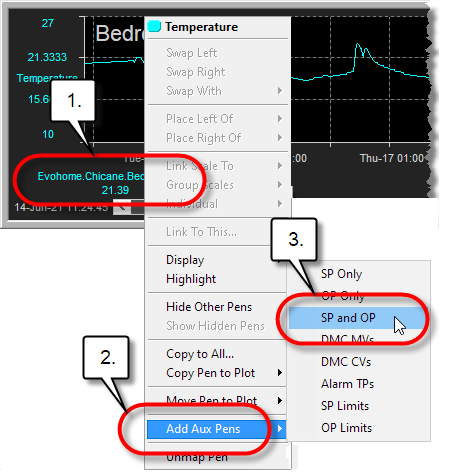
- Step 1 – Right-click over the required Master Pen – this usually has a parameter of .PV on the end of the item name, but can also have no parameter specified.
- Step 2 – Select “Add Aux Pens” from the right-click menu.
- Step 3 – Click on the “Add Aux Pens” Pen set you wish to add – in this case ‘SP and OP’.
A range of Aux Pen sets are available all of which will add different auxiliary items based on the selected ‘master’ pen.
Assuming that the derived item names exist within the plots’ Data Source, then the new pens will be added using the required styling, color and scaling. If not an appropriate error message will be displayed listing any pens that could not be added as the required item did not exist.
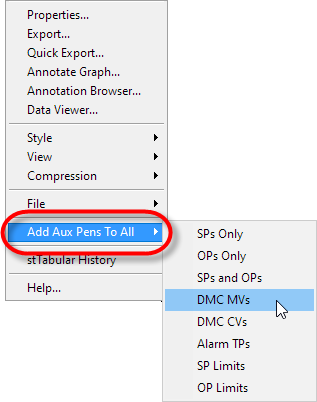
Add Aux Pens To All
The option is also available at the plot level – meaning you can add the associated auxiliary pens to every candidate PV pen mapped in a plot with a few simple mouse-clicks.
File modification indicators
When working with either plot or session files stPro now displays an asterisk (i.e. a ‘*’) after the file name within the application window to indicate that a modification has occurred.
This makes is very easy to see which plots have been changed in multi-plot sessions, or which sessions have been changed when working with multiple sessions in Tabs.
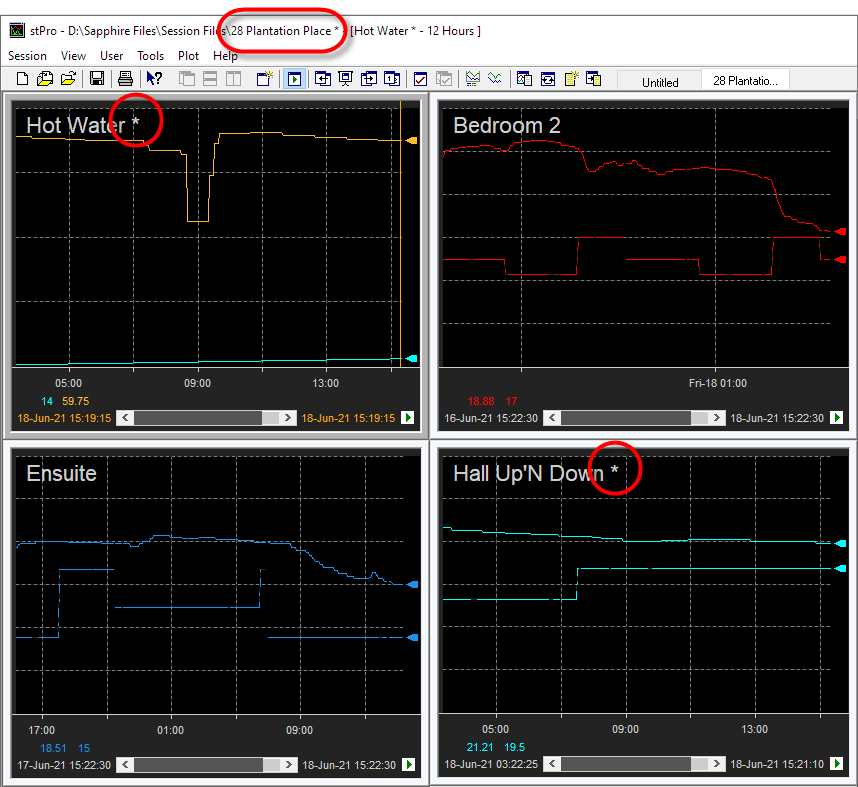
Note – in the above example the plot title bars have been disabled to maximize graph acreage. When enabled, the asterisk is also displayed within the title bar and also on the tab right-click menu for session changes.
Save/Discard/Review All
When working with complex multi-plot instances of stPro it is usual to make changes to a large number of files as plots are adjusted and refined during normal operation and analysis.
Closing Sessions
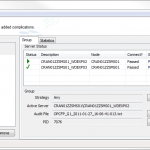
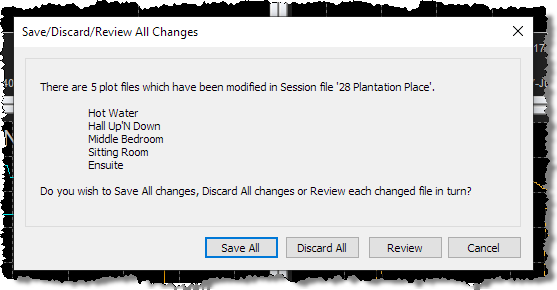
With the latest updated 6.4 release the user is presented with a summary dialog listing the plots within each session that have been changed.
So it is much easier to know whether you wish to save the changes or not.
The dialog offers a range of single-click options rather than requiring a long sequence of user inputs:
- Save All – Save all the changes to all the modified files immediately without prompting the user for further input.
- Discard All – Abandon all the changes made without prompting the user for further input.
- Review – Cycle through each changed file in turn allowing the user the chance to save or discard the changes to each modified file.
- Cancel – Abort the close operation.
Closing the application window
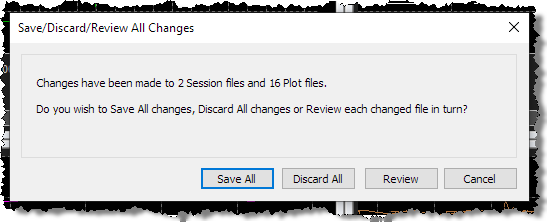
Similar logic has also been implemented when closing an instance of stPro that has multiple sessions loaded in as tabs.
Given the increased file count across (potentially) multiple sessions, it does not list the individual files that have changed, but instead reports a high level summary of what has changed in terms of file counts.
If the Review option is chosen, then the user will cascade down to the Session level dialog and be able to see the details of the actual changes.
Pen Labels
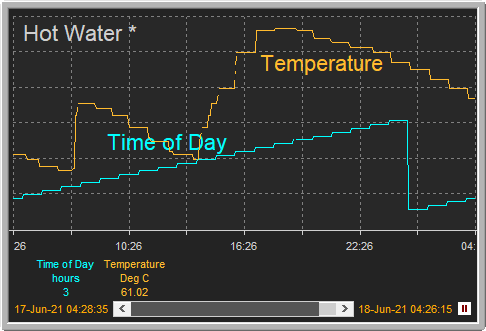
Sometimes it can be useful to see labels for trend lines within the actual plot window itself, not just listed in the Item Details Area under the trend. With this in mind a new Pen option of “Label” has been added. When checked, the contents of the Pens’ Display field are shown within the plot window.
The label is displayed using the same color as the pen with its position being automatically calculated. The X-position is based on the number of pens with the Label option checked (to spread lables from left to right evenly) and the Y-position is based on the pen value at the X-position.
Pen Labels can be enabled via the Plot Properties Pens tab or the Item Details Area right-click menu. Like a lot of other pen settings the option can be swiftly copied to other pens via the Pens “Copy to All” feature.
Copy/Move Pens to other plots
On occasion it can be useful to use one plot to seed the pens in another plot, or perhaps to split a single plot that has become too congested into two. The new Copy Pen to Plot and Move Pen to Plot features allow the user to do both. The Copy option creates an instance of the chosen pen in the second plot, whilst the Move option adds the pen to the second plot whilst also removing it from the source.
Both options are available via the Pen right-click menu in the Item Details Area under the trend and also via the Plot Properties Mapping tab. The latter allows multiple pens to be moved or copied via the multi-row select option.
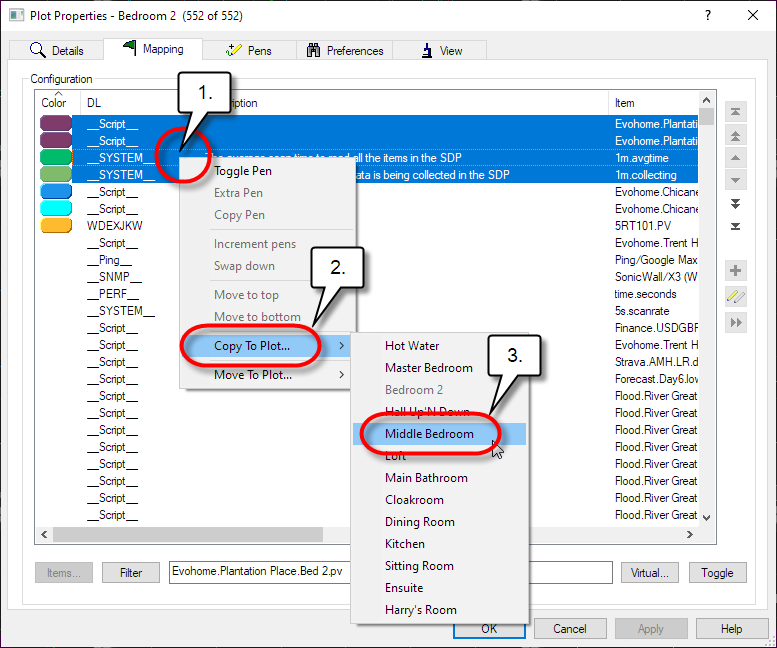
Operation
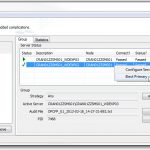
- Step 1 – Select the required rows by highlight them with the mouse and then Right-click over the dialog.
- Step 2 – Choose either “Copy to Plot…” or “Move to Plot…”
- Step 3 – Select the plot the pens should be added to.
The pens will then be added to chosen plot. All of the pen details will be copied across, including the color, line style and scaling mode. So if the pen scale was linked to Pen 1 in the source plot, the Copy/Move operation will attempt to Link it to whatever is Pen 1 in the target plot.
Note, only items that are mapped to pens on the Plot Properties Mapping tab will be moved or copied. Items that have been selected, but which are not mapped to pens will be ignored.
Mouse Scroll wheel integration
The mouse scroll wheel can now be used to zoom and pan Sapphire plots. This provides increased control and granularity than is available via the keyboard, or menu based zoom and pan options.

Panning
To pan through time, spin the mouse scroll wheel up and down.
Zooming
To zoom in and out, spin the mouse scroll wheel up or down whilst holding the mouse wheel down, or whilst pressing any of the mouse buttons.
Want to know more?
For more information about Release V6.4 see the original release news article here, or visit the New Features or Release Notes pages of the Online Help.