
Release V6-1 is the latest version of SapphireTrend, Jemmac Software’s world leading real-time process visualization package.
Headline features in V6-1 include new graphs styles of Area Charts and Stacked Area Charts, free text labels for X-Y Graphs, the ability to define static values as part of boundary groups and an option to display delta values instead of absolute values, thereby providing a ‘rate of change’ between scans on a per pen basis.
Area Charts
Much like Line (Strip) Charts, Area Charts show continuity across a data set for time series data. But whereas Line Charts allow a large number of pens to be trended for comparison, Area Charts are best used to display cumulative data sets and where you wish to analyze a ‘part to whole’ relationship.
Due to their high use of colour, Area charts also provide a highly visible trend when viewing plots form a distance, for example across a large control room.
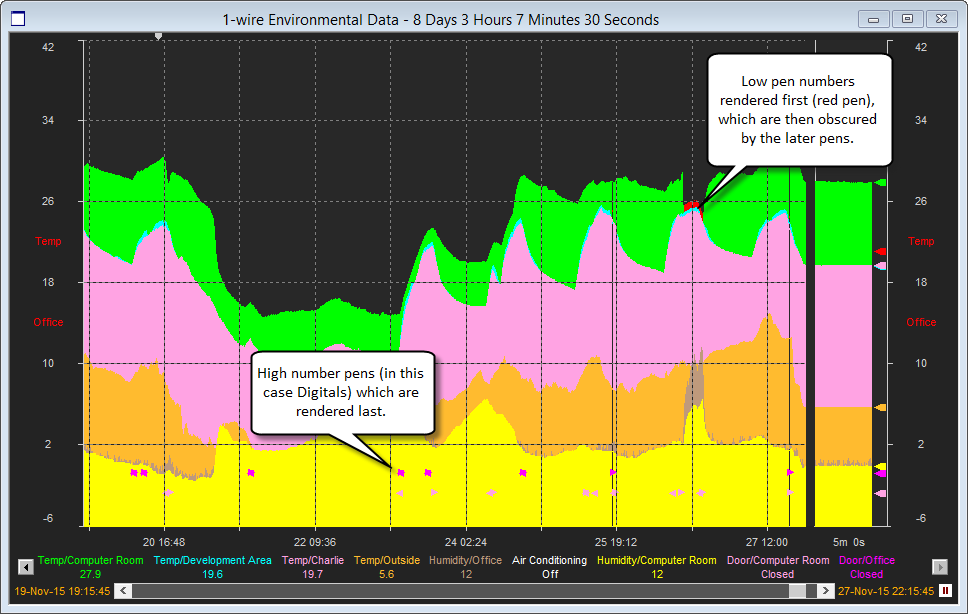
When creating an Area Chart, care must be taken with pen ordering as a high degree of occlusion can occur when pen values and scales overlap. It is therefore useful to know that pens are rendered in order, so pens should be ordered such that those which you wish to appear in the ‘foreground’ are assigned high pen numbers.When creating an Area Chart, care must be taken with pen ordering as a high degree of occlusion can occur when pen values and scales overlap. It is therefore useful to know that pens are rendered in order, so pens should be ordered such that those which you wish to appear in the ‘foreground’ are assigned high pen numbers.
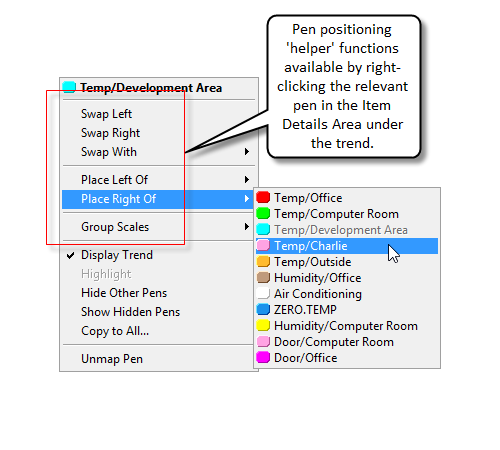
To help with this stPro includes raft of easy-to-use mechanisms for re-ordering pens, critically without losing their individual settings or scales.
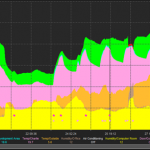
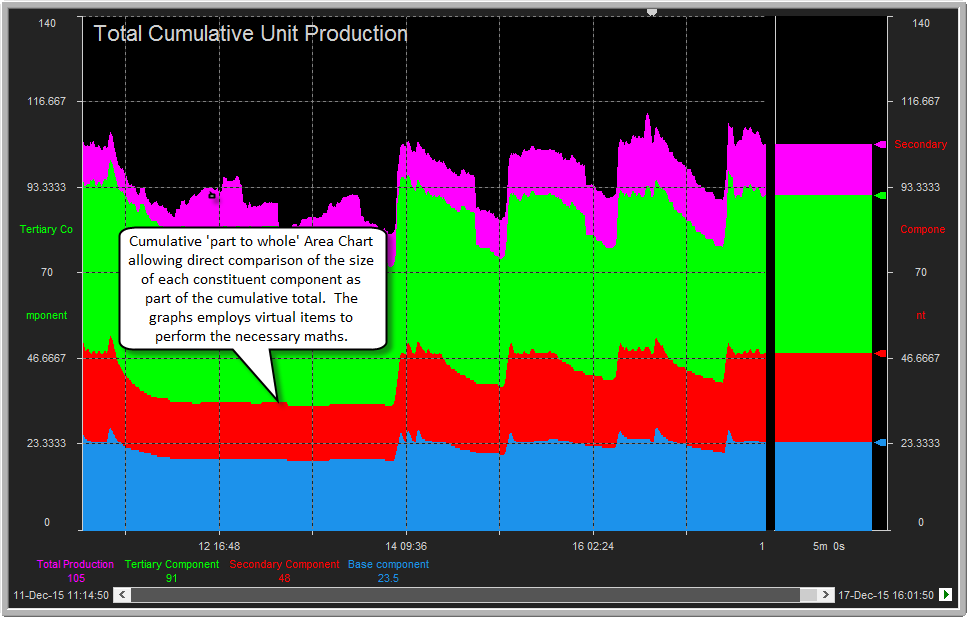
Where the user wishes to display a cumulative data set, for example the production from various areas of plant along with an overall view of the total production, virtual items can be used to create a very effective Area Chart display.
Pen 1 would typically be a raw data value, Pen 2 would be set up as a virtual item whose value is the sum of Pen 1 and Pen 2. Pen 3 would be the sum of Pens 1, 2 and 3 and so on. The final pen would then be a virtual item displaying the sum of the raw values of all of the pens.
The following example shows how this looks in practice:
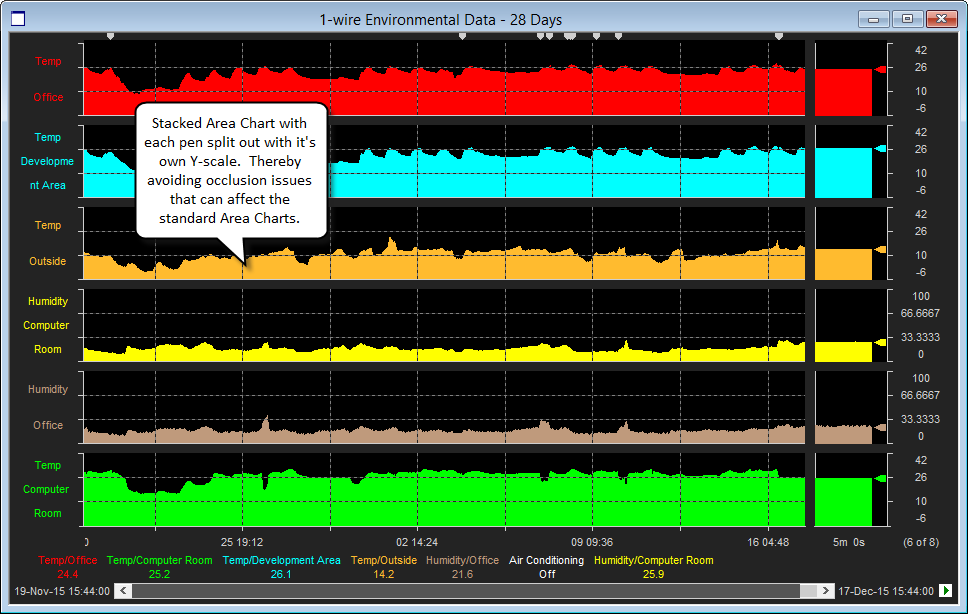
Stacked Area Charts
One very easy way to avoid the overlay/occlusion issues that can occur Area Charts is to use the stacked version. This separates each pen out to have it’s own Y-axis providing a very clear view of each.
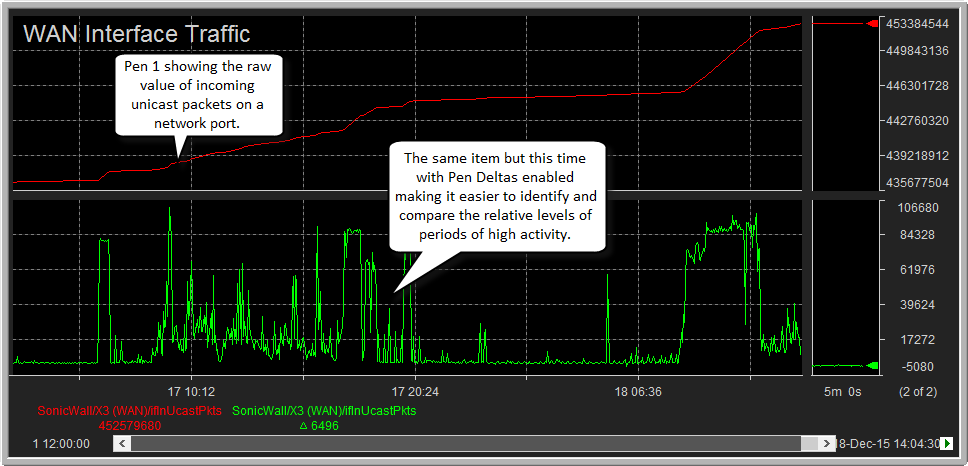
Pen Deltas
When trending items that continuously increase or decrease it is generally more useful to plot the difference in value between two consecutive scans than the actual value of the item.
Consider the examples of trending the number of packets received on a network port, or when trending the memory used by a process. In both cases the resulting trend line will continuously tend upwards, requiring the scales to be constantly revised and making it difficult to determine if the load is increasing or decreasing.
The new pen representation option “Delta” allows the user to elect to plot the difference between scans instead of the raw values. This greatly increases the readability of the trend making it easier to determine ‘activity’ levels for the items being plotted.
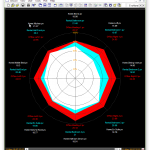
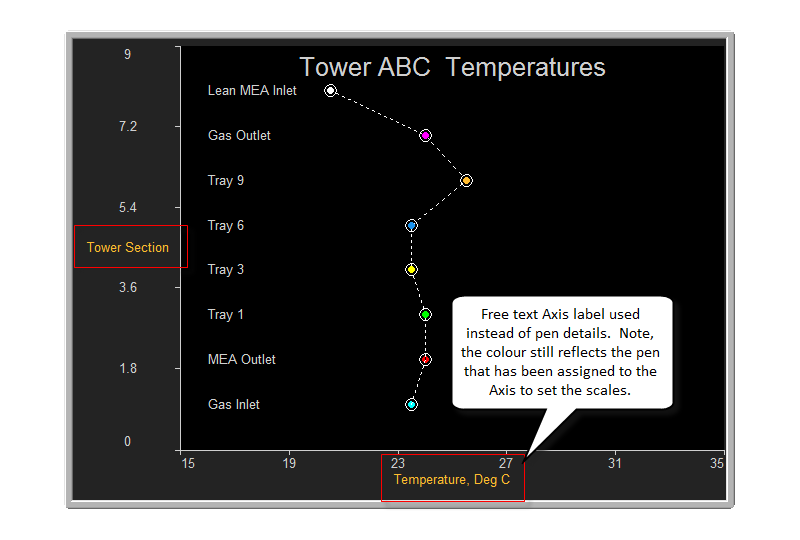
Free text X-Y labels
With X-Y graphs it is common for an Axis to have a common unit and scale – for example when trending temperatures. In such a situation using the pen details for the axis labels is inappropriate as this would result in a label along the lines of “Tower1.temp”.
Release 6.1 adds the ability to define free text labels for X-Y Graphs so instead of an item name, a more generic label of “Temperature/Deg C” can be used greatly increasing the clarity of the graph.
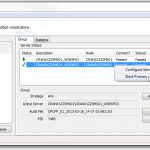
Static Data Values
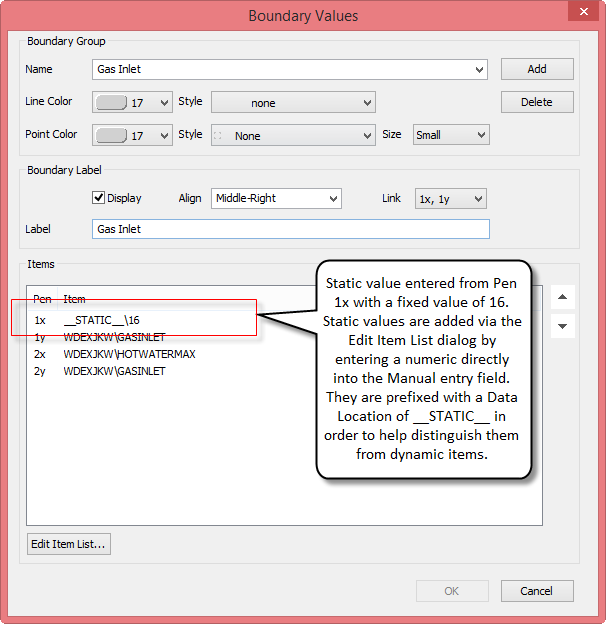
Boundary Groups allow the user to overlay shapes on X-Y Graphs. The co-ordinates of the shapes are defined using trend items allowing the overlay to be dynamic. However, when the overlay is static the process of having to create an item and setting it to the required static value is cumbersome.
Release 6.1 adds the ability to define static co-ordinates within the product eliminating the need to create the items on the Data Source being used for the trend (for example on the DCS).
For more details about SapphireTrend, see the Product page for it.