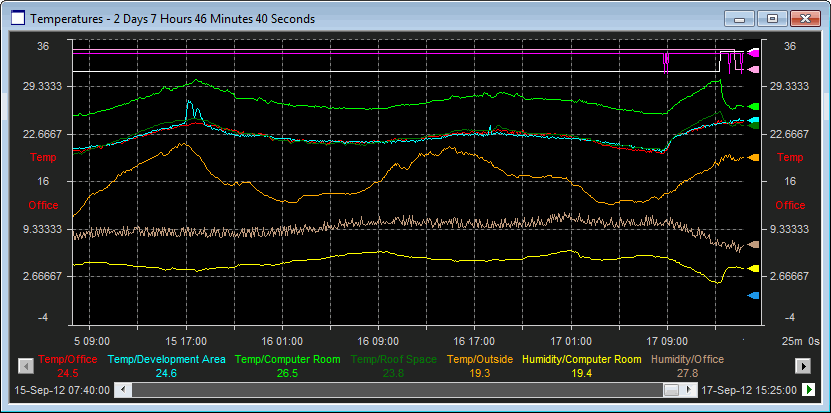
Strip-charts are an established method of representing continuously varying values by plotting a series of data points against time. This provides a highly visual way to view the data providing an effective way to compare a number of signals at a single point in time.

Tip: For more details on strip-charts see the section on the Plot window.