Note: Pen Pointers can be enabled or disabled on a per plot basis.
Tip: The size of the Pen Pointers can be controlled via the Pen Pointer Size control on the Plot Tab on the User Preference dialog.
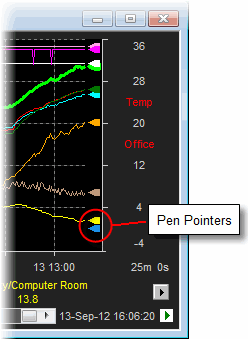
Pen Pointers provide a mechanism for highlighting the position of the last data value read for a pen on the right hand Y-axis. They provide a useful visual indication of the current process value similar to the position of a pen on physical strip chart records.
|
|
Note: Pen Pointers can be enabled or disabled on a per plot basis. Tip: The size of the Pen Pointers can be controlled via the Pen Pointer Size control on the Plot Tab on the User Preference dialog. |
Normally as a plot is zoomed out, so the update rate slows down to reflect the fact that not all the data points can be displayed. This means it is possible to unwittingly miss significant events. With live updates enabled, the Pen Pointers will continue to refresh at the data collection frequency regardless of how far zoomed out the plot is.
|
|
Note: When Live Updates are enabled, then pen pointers will not necessarily align well with the trend lines, since the trend lines can update at a much slower rate than the pointers. To help reinforce this, and additional vertical separator is displayed between the trend and the Pen Pointers when Live Updates are enabled. Tip: Live Updates can be enabled via the appropriate control on the User Preferences Plot Tab. |
From the Plot menu, select View and Pen Pointers.
OR
Right-Click on the required Plot and select View and Pen Pointers.
OR
Select the View tab on the Plot Properties dialog and check Pen Pointers in the view section of the dialog.