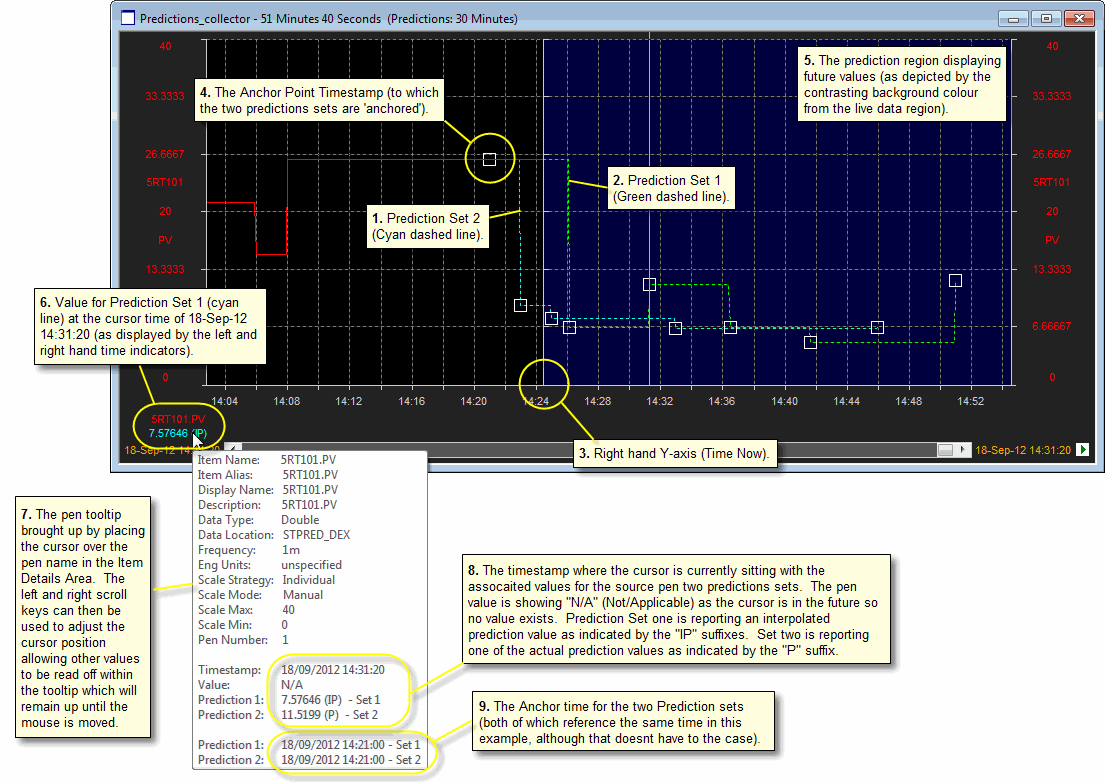
Predicting how a production process will change over time is a specialised and complex operation best left to mathematical modelling applications such as constrained multi-variable controllers. As a Process Visualization tool stPro, is concerned with displaying raw data and does not perform any calculations upon the values is trends - "what you see, is what is happening".
However, in many situations it is desirable to be able to trend the predictions from a controller with the live values from the plant. This capability was added to stPro in release V3-3 and is known as Predicted Values.
This section discussed how to set stPro up to retrieve such 'Prediction Sets'.
Note: Thus in order to see predictions within stPro, the third party application must write the Prediction Sets to an OPC Data Source so that stPro can retrieve and display the predictions at the appropriate time offsets.
The Predictions dialog is used to define one or more Prediction 'sets' for a given pen.
When predictions are in effect, the Right hand Y-axis for the plot will be moved left to indicate that the current time is no longer on the right hand extreme of the plot window.

Tip: A specific palette entry also exists for displaying the time period that is in the future to help differentiate real data from the predictions.
Note: Having defined a Prediction Set the user must enable Prediction for the active plot via the Plot View options.
When the plot cursor sweeps over the plot area displaying the future predictions 'Predicted' will be displayed for each of the Prediction sets.
Tip: To determine the value of the prediction enable the Item details area tool tip for the source pen. The value of each Prediction Set is displayed for each time point on the trend.
A Prediction set consists of:
A pen color palette entry so that the prediction is easily distinguished from the actual values for the source pen.
A pen line style (as above)
A Timestamp which defines the Anchor Time for the prediction. The Timestamp is read from two OPC items defining the number of days since the 1st of January 1900 and the number of Milliseconds into the current day.
Note: The timestamp must be specified in UTC (Coordinated Universal Time) and not in local time.
One or more Prediction Items whose values reflect the anticipated value of the source pen at some point in the future.
Note: It is the responsibility of the application that is generating the prediction to update the values of the Timestamp when a new prediction is written to the Prediction Items.
Each prediction item has a Time offset associated with it which dictates how far into the future the value should be shown. There is no requirement for the Time Offsets to be regularly spaced.
Note: It is the responsibility of the third party application that is providing the predictions to write the appropriate value to each Prediction item for the desired Time offset from the Anchor point Timestamp.
The Anchor time defines the time when the prediction was last updated by the modelling application. There are two methods for specifying the Anchor time for a prediction set. By selecting "Now" the user avoids the need to 'manage' the anchor time. However, there are several advantages to specifying an anchor time.
The Anchor time is split across two OPC items so that it high degree of granularity can be obtained from single precision floating point values. The Anchor time MUST be specified in UTC.
Tip: To calculate the day component, run Microsoft Excel, enter a formula of "now()" and set the format for the cell no be a number. The whole number is the number of days required.
The Anchor time conveys when the prediction was made to the end user. It also allows us to 'age' the prediction set by allowing it to drift left across the trend. As the prediction set drifts and additional real data is scanned you get a good visual indication of how far away from the predicted values the actual data was for each time offset in the prediction set. When a new prediction is made, the prediction set will jump forward to the new anchor time.
The anchor time also helps identify if/when the model is no longer running as the prediction set will drift across the trend to the left. To help with this the associated pen tool-tip also displays the time when the last prediction was made.
This gets around the hassle of providing an anchor time, but the prediction always appears to be current, even though it might have been made several minutes (or hours) ago. Also in normal operation using "Now" only really works when the graph is updating at the same frequency as the model. Otherwise the prediction appears to be more current than is the case, and it is not being compared against the data set from when the prediction was made.