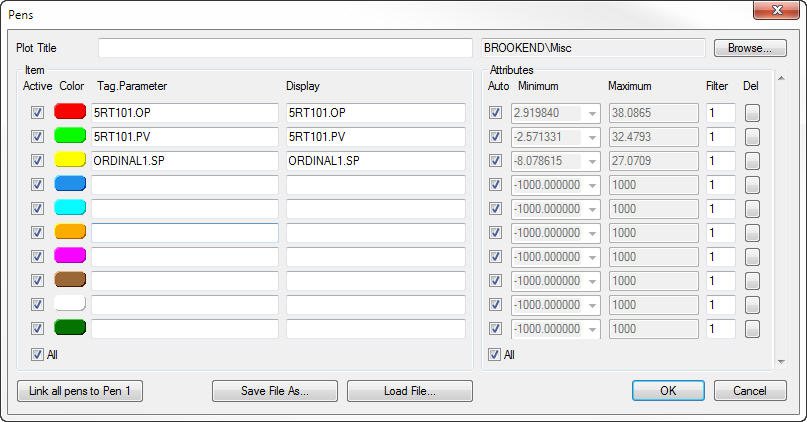
The Pens dialog allows a simplified means of entering pen names.
Tip: Initially ten lines will be presented to enter pen names. Once these ten lines are used, extra lines will always be added so an unlimited number of pens can be displayed.
|
Control: |
Purpose: |
|
The name used in the plot header. |
|
|
This may be selected automatically (because it is the only option for the current connection) - alternatively click on "Browse" to discover alternate sources. |
|
|
|
A pen may be temporarily removed from the plot screen by un-checking this box. The pen remains in the system and may be reinstated at any point. |
|
For simplicity, the colors that will be assigned to a pen are listed in the order they appear in the stPro preferences.
Tip: If you fill in an item name on a line further down in the list, skipping others, the color on the line you have selected will be used. |
|
|
The name of the item to plot. If this item does not exist on the server it will be removed from the server. The user can enter an item name by just typing the parameter component of the name.
For example if a parameter name of ".PV" is entered, the tagname of the item name on the previous line will automatically be used in the name.
The scales for the new pen will also be linked back to the pen defined on the preceding line.
Note: The "." at the front of the word is important, otherwise the name will be used on its own, without assuming it is a suffix. An equation can be entered in this field such as: caf101.pv-caf101.sp
Any equation that does not parse or an Item does not resolve will result in a warning and the background of the offending line will change color. |
|
|
The name to display on the plot. If left bank, the name used in the Tag.Parameter field will be used. |
|
|
Use auto scaling. When checked, the Minimum and Maximum fields will be disabled and the scale limits calculated using the range of the item data that will be visible on the plot. |
|
|
The minimum value of the Y-scale for this pen can be entered into this field. Alternatively this field may also be used as "Group with Pen"; an existing pen may be chosen from the drop down so that all the pens grouped with the same pen will all contribute to the scale calculation. |
|
|
The maximum value of the Y-scale for this pen can be entered into this field. If the Auto box is checked or if a pen is chosen, this field is disabled. |
|
|
A Filter value of 1 indicates that the actual values read should be displayed on the plot. The Filter value can be reduced to smooth the plot and remove "spikes". |
|
|
Click this button to clear the Tag.Parameter from the line. It will be removed from the list of displayed items when OK is pressed. |
|
Button: |
Purpose: |
|
This button will group all pens together. |
|
|
Open the dialog to save a plot file by a different name. |
|
|
Open the dialog to select and load a standard stPro plot file. |