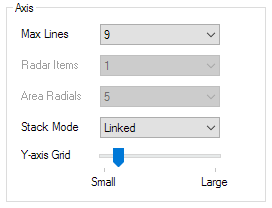
Use this section of the tab to control the axis settings for the active plot.

|
Control: |
Default: |
Purpose: |
|
Set via User Preferences |
The maximum number of Y-axis Scale lines to display on the active plot. The count includes both the X-Axis and the top scale marker. This setting allows the user to define a multiple that will provide suitable intermediate scale labels.
Note: Should the plot size reduce to the point that the chosen setting no longer fits, the number of Scale lines will be automatically reduced (hence the fact it's a maximum). |
|
|
1 |
Specify the number of item values to display on each axis when using the Radar Graph Style. For values of more than 1, pens are assigned to each axis in the required multiples. So if Items Per Radar Axis is set to 2, Pens 1 and 2 will be assigned to the first axis, Pens 3 and 4 to the second and so on.
Note: The Items Details displayed always relate to the primary (first) pen assigned to the axis. Only the values of the subsequent pens are displayed. Tip: The additional pens assigned to an axis (i.e. not the primary pen) can be viewed via the Item Details Tooltip. The item names are shown to the right of the associated values. |
|
|
Area Radials |
8 |
The number of radials required per polygon for Radar Area Charts. The pens in the plot will be assigned from 1 to this number per polygon. For a plot with 24 pens, a value of 8 will generate 3 polygons with 8 radials (and pens) each. For the same plot a value of 6 would produce 4 polygons with 6 radials (and pens) per polygon.
Note: If the number of pens does not equally divide into the no of Area Radials then the remaining items will be displayed on the radials, but will not generate a polygon. |
|
Linked (D) Single |
Dictates whether pens with Linked Scales should be shown within the same stack as the parent pen, allowing better comparison of pens whilst maintaining the display acreage benefits of Stacked charts.
Note: Applies to Stacked Strip Charts and Stacked Area Charts only. Tip: The order of the stacks can be changed by right-clicking over the Y-axis labels and using the pen movement operations, which for Linked Stacked Charts will list the lead pen in each stack rather than the individual pens. |
|
|
Y-Axis Grid |
N/A |
The initial number of Y-axis grid lines shown on a plot is automatically calculated based on the width of the plot in pixels and the chosen plot duration. However, the user can bias this calculation using the Y-Axis Grid control.
Tip: Moving the slider to the left will decrease the number of vertical grid lines and moving it to the right will increase the number of vertical grid lines. |