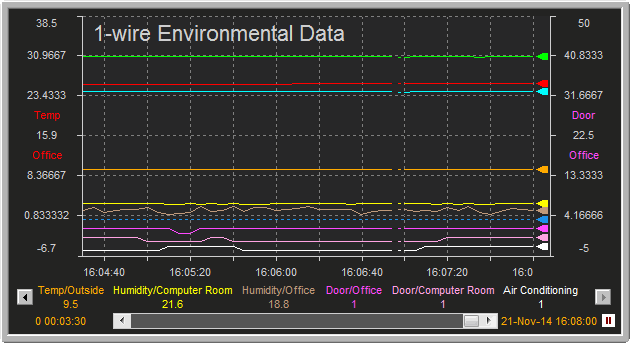
Strip charts are an excellent way representing continuously changing analog data but are less effective for displaying digitals values which typically follow a range of predefined values. For example, a digital pen may just have two states - 1 or 0. So any resulting trendline will end up as square wave. If the trend contains other digital pens operating over the same range, the result will a very busy and confused display unless the scales are arranged very carefully to minimise overlap.
The following example contains three digitals pens - Door/Office, Door/Computer Room and Air Conditioning. Each of which can have values of either be 1 or 0 (representing On/Off and Open/Closed). The trend also includes a range of analog pens representing temperatures in degrees C.
Changes in value for the digital pens are represented by 'steps' in data, but the changes are hard to pick out despite the scales being set to position the digital pens underneath the analog pens at the foot of the plot to aid clarity.

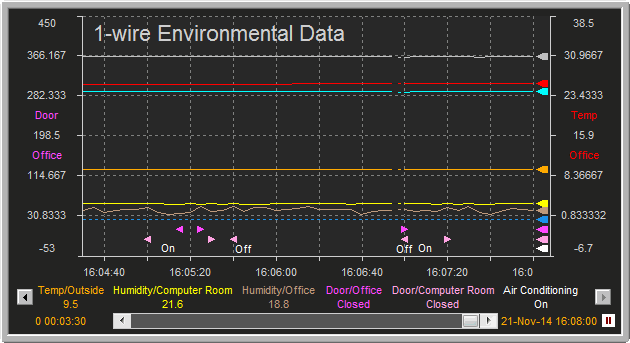
Contrast that with the following plot release 6.0 screen shot displaying the same data set. The analog pens remain unchanged, but the three digital pens are now represented using a combination of symbols (for Door/Office and Door/Computer Room) and Aliases (text strings) for Air Conditioning. The symbols and aliases are only displayed on data change, so the plot has much greater clarity.
In addition, enumerations have been defined so that a textual representation of the data can be displayed in the Item Details Area. So rather than displaying a value of "1" and leaving the user to remember what that means, a more meaningful value of "Closed" or "On" can be displayed instead.
Note: The actual value of the pen can still be determined via a new Tool tip added to the pen pointers.

Tip: See the following sections to understand how to set a pen to use the Digital settings and define the associated ordinal and enumerations for each of the values.