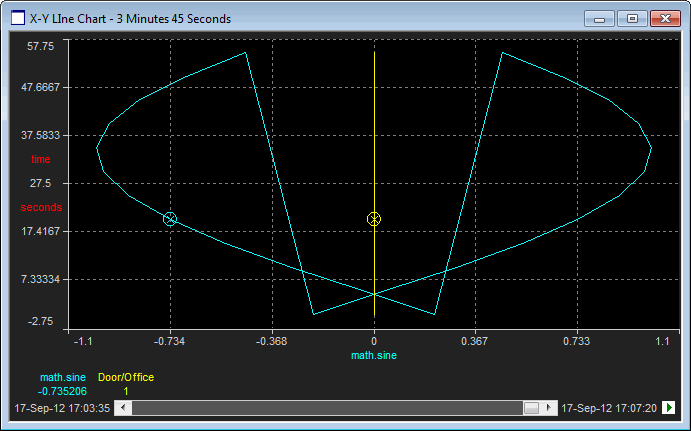
X-Y Line graphs are similar in nature to X-Y Scatter graphs, but instead of each data pair being delimited by a symbol, consecutive data pairs are connected with lines. This provides some time sequencing which is not possible with X-Y Scatter graphs.
Tip: To 'traverse' data pairs in time sequence, click on the plot to turn on the plot cursor and use the left and right cursor keys to scroll through the data pairs.

Note: When changing graph styles, pens 1 and 2 will automatically become the first data pair of 1x and 1y. Similarly pens 3 and 4 will become pair 2x and 2y and so on ...
Tip: To aid visualization the data pairs for the latest time slice can be circled to help differentiate new data as it 'arrives'. This option is set on the Advanced tab of the User Preferences dialog.