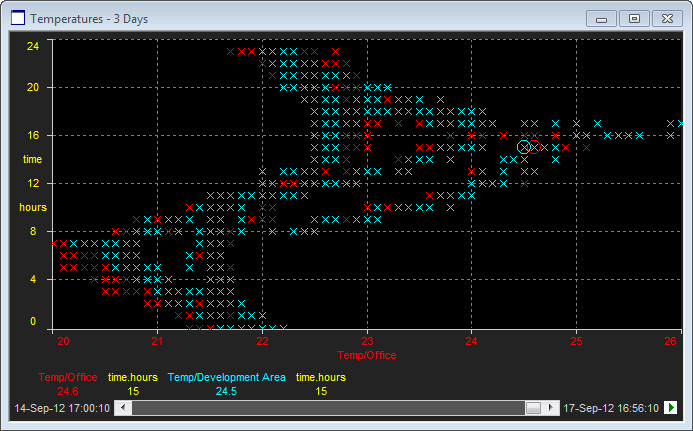
X-Y Graphs provide an effective way for looking for correlations between pairs of data points. As this representation is not time based it is possible to see patterns and relationships that cannot be seen via strip-charts or radar plots.
The number of data pairs displayed is based on the chosen plot period, so actions such as zooming in and out will change the number of data items shown. Similarly pan operations can be performed to see combinations for earlier time periods.
Note: It is always the X component of a data pair that sets the color and symbol style for the pair.

Note: When changing graph styles, pens 1 and 2 will automatically become the first data pair of 1x and 1y. Similarly pens 3 and 4 will become pair 2x and 2y and so on ...
Tip: To aid visualisation the data pairs for the latest time slice can be circled to help differentiate new data as it 'arrives'. This option is set on the Advanced tab of the User Preferences dialog.